

Careers
Top 10 Nutritional Beverage Products for Global Buyers
Global buyers are increasingly seeking nutritional beverage products that combine convenience, clear labeling, and dependable nutritional value. This guide explores ten product categories suited to different retail channels, consumer habits, and regional demands. Options may include protein drinks, fortified waters, plant-based beverages, electrolyte formulas, meal replacements, and functional teas.
Quality begins with more than attractive packaging. Buyers should examine ingredient lists, nutrition panels, allergen statements, shelf-life data, and production standards. A beverage with 20 grams of protein may appear competitive, yet its sugar level, flavor system, or serving size can change its real value. Small details matter. Bottle size matters too.
Reliable suppliers should provide traceable sourcing, consistent batch testing, and documentation for export markets. Certifications can support trust, but buyers should verify their scope and validity. Local labeling rules, permitted claims, import requirements, and language expectations also require careful review. A product successful in one country may need reformulation elsewhere.
This overview is designed for distributors, wholesalers, retailers, and private-label buyers comparing international opportunities. It considers formulation, packaging, consumer appeal, logistics, and commercial practicality. No ranking can suit every market. That is an important limitation. Costs, tastes, climate, and regulations vary widely.
Some products may perform well in gyms, while others fit pharmacies, supermarkets, offices, or travel settings. For example, a resealable 500-milliliter bottle may suit active consumers, while a compact carton can reduce transport space. Buyers should request samples and test them with real customers before making large commitments. Practical feedback often reveals weaknesses that product specifications cannot show.
Global Nutritional Beverage Market Scope: 6.8% CAGR Forecast Through 2030
Top 10 Nutritional Beverage Products for Global Buyers
The global nutritional beverage market is projected to grow at a 6.8% CAGR through 2030. This forecast reflects rising demand for convenient nutrition, active lifestyles, and fortified daily drinks. Grand View Research identifies functional nutrition, protein beverages, and hydration products as major growth areas. The numbers look promising, but forecasts are not guarantees.
For global buyers, the strongest product groups include protein shakes, electrolyte drinks, fortified dairy beverages, plant-based drinks, meal replacements, probiotic beverages, fiber drinks, vitamin waters, low-sugar energy products, and specialized nutrition formulas. Euromonitor International highlights health positioning and ingredient transparency as important purchasing factors. Buyers should check protein content, sugar levels, allergen statements, shelf life, and cold-chain requirements before sourcing.
Details matter.
The World Health Organization recommends limiting free sugars to less than 10% of daily energy intake, with further benefits below 5%. This supports demand for reduced-sugar formulations, though taste can suffer when sweetness falls sharply. Suppliers need reliable laboratory testing, traceable ingredients, and packaging suited to local climates. NielsenIQ and other retail studies also show that shoppers increasingly compare labels, prices, and functional claims before purchase. Some market forecasts may overstate adoption because consumer preferences change quickly. Regional regulations and cultural tastes remain difficult to predict.
Nutritional Beverage Classification by Protein, Energy, Vitamins, and Hydration
Top 10 Nutritional Beverage Products for Global Buyers
Nutritional Beverage Classification by Protein, Energy, Vitamins, and Hydration
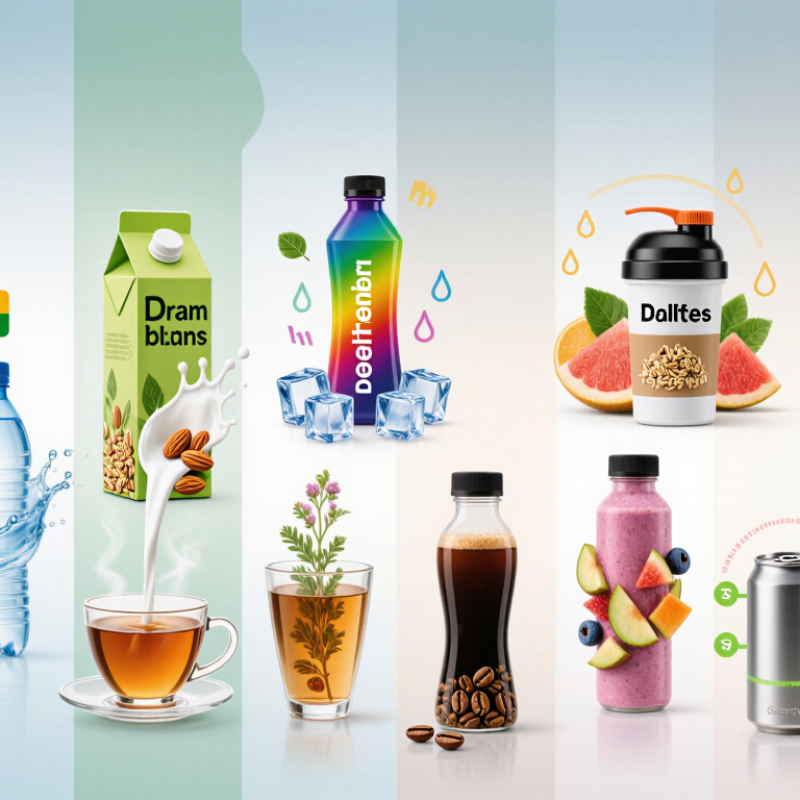
Global buyers can classify nutritional beverages by their primary function rather than attractive packaging. Protein shakes support convenient protein intake after training or during busy workdays. Clear protein drinks offer a lighter texture. Meal-replacement beverages combine protein, carbohydrates, fats, and selected micronutrients, but buyers should review serving sizes carefully. Energy beverages provide calories from carbohydrates or other permitted ingredients. Their caffeine content must match local rules and consumer expectations.
Vitamin drinks may contain vitamins A, B, C, D, or minerals such as calcium and magnesium. Fortified juices can suit shoppers who prefer familiar flavors. Hydration products include electrolyte drinks, mineral waters, and dissolvable hydration powders. These products may help replace fluids after heat exposure or exercise. They are not universal solutions. Individual needs differ. Buyers should check sugar levels, sodium content, allergens, shelf stability, and evidence behind every claim. Independent laboratory testing strengthens reliability, while transparent certificates support responsible sourcing.
Tips: Compare nutrition panels, not just front-label promises. Ask suppliers for recent test reports and stability data. Confirm permitted claims in each destination market. A simple formula may be easier to register and understand. However, low cost can hide weak flavor, poor solubility, or unstable nutrients. I have found that taste testing under realistic conditions matters; a beverage accepted in one climate may perform poorly in another. Also consider packaging weight, recycling systems, storage temperatures, and language requirements before placing a large order.
Top 10 Nutritional Beverage Products Ranked by Global Buyer Demand
Global buyers currently show strongest interest in protein shakes, electrolyte drinks, vitamin waters, probiotic beverages, and meal replacement drinks. These categories lead because they fit fitness, convenience, and everyday wellness routines. Energy beverages with added nutrients rank sixth, followed by plant-based nutrition drinks, collagen beverages, prebiotic fiber drinks, and fortified dairy beverages. This ranking is practical, not absolute. Regional income, climate, and retail access can change the order.
Grand View Research valued the global functional beverages market at approximately USD 182 billion in 2022. Its report also projects a strong growth rate through 2030.
Innova Market Insights’ 2024 analysis highlights digestive health, energy, and protein as major innovation areas. Buyers should examine repeat purchase data, not only launch volume. Some products look popular online but move slowly in physical stores. That gap deserves attention.
Tips: Request laboratory test results, shelf-life evidence, allergen controls, and ingredient traceability before sampling. Check whether nutrition claims are supported in each target market. Prioritize clean labeling and stable supply. Packaging size matters, too; single-serve formats often suit gyms and convenience channels. The “best” product may still fail if taste, texture, or freight costs disappoint.
Regulatory Benchmarks: WHO’s <10% Free-Sugar Limit and Codex Standards
For global buyers, nutritional beverage selection starts with sugar control, not attractive packaging. WHO’s 2015 guideline recommends free sugars below 10% of daily energy intake. It suggests an additional benefit below 5%, or about 25 grams daily for a 2,000-calorie diet. A 500-millilitre drink can exceed that level quickly. The WHO Global Health Observatory reports that noncommunicable diseases cause 74% of global deaths, strengthening demand for practical reformulation.
Codex offers a useful international reference, but it does not set one universal sugar limit for every beverage. Buyers should check Codex General Standard for Food Labelling, CXS 1-1985, and the Guidelines on Nutrition Labelling, CXG 2-1985. Ingredient names, nutrition panels, allergen statements, and permitted claims still require local review. Codex also expects claims to be truthful and scientifically supportable. A lower-sugar drink may still contain concentrated fruit juice or sweetening ingredients. That detail deserves attention. Innova Market Insights’ 2024 global food and beverage analysis identifies health positioning as a major innovation driver, yet consumer expectations differ sharply by region.
Tips: Request laboratory results for total and free sugars. Compare serving size with the actual bottle. Check claims against destination-country rules. Ask suppliers for Codex alignment, shelf-life evidence, and a complete ingredient specification. Treat “natural” as a marketing description, not a nutritional guarantee. One practical weakness remains: international benchmarks improve screening, but they cannot replace country-specific legal review.
Top 10 Nutritional Beverage Products for Global Buyers - Regulatory Benchmarks: WHO’s <10% Free-Sugar Limit and Codex Standards
| Rank | Generic Beverage Product | Primary Nutritional Positioning | Typical Serving Size | Typical Sugar per 100 mL |
WHO Free-Sugar Screening | Key Codex Reference | Global Buyer Compliance Check |
|---|---|---|---|---|---|---|---|
| 1 | Plain Drinking Water | Hydration; zero sugar and zero energy | 250–500 mL | 0 g | Meets benchmark | Codex CXS 108-1981, General Standard for Bottled/Packaged Drinking Waters | Verify source protection, treatment, microbiological safety, mineral declaration, and permitted claims. |
| 2 | Unsweetened Fortified Plant-Based Beverage | Plant protein or micronutrient fortification without added sugar | 200–250 mL | 0–2 g | Usually meets benchmark | Codex CXS 1-1985 for labeling; Codex CXS 192-1995 for food additives | Confirm plant source declaration, allergen controls, fortificant authorization, nutrition panel, and “unsweetened” substantiation. |
| 3 | Low-Sugar Electrolyte Beverage | Fluid and electrolyte replacement with controlled carbohydrate content | 250–500 mL | 2–5 g | Generally aligned | Codex CXS 1-1985; Codex CXS 192-1995 | Check sodium, potassium, carbohydrate, sweetener permissions, sports-performance claims, and local classification. |
| 4 | Unsweetened Fermented Milk Beverage | Protein, calcium, and live-culture positioning | 150–250 mL | 4–5 g | Typically aligned* | Codex CXS 243-2003, Standard for Fermented Milks | Distinguish naturally occurring lactose from added sugars; verify starter cultures, milk solids, refrigeration, and probiotic claims. |
| 5 | Reduced-Sugar Dairy Protein Beverage | High-protein nutrition with reduced added sugar | 250–330 mL | 3–6 g | Often aligned* | Codex CXS 1-1985; Codex CXS 192-1995 | Validate protein quantity, source, amino-acid claims, sweeteners, allergen labeling, and use of “high” or “source of” claims. |
| 6 | 100% Fruit Juice | Fruit-derived beverage containing naturally occurring sugars | 150–200 mL | 8–12 g | Portion control required* | Codex CXS 247-2005, General Standard for Fruit Juices and Nectars | Confirm juice percentage, permitted reconstitution ingredients, Brix or soluble-solids requirements, and no-added-sugar labeling. |
| 7 | Fruit-and-Vegetable Smoothie | Fruit, vegetable, and fiber positioning | 200–300 mL | 6–12 g | Recipe and portion dependent* | Codex CXS 247-2005 where juice/fruit-juice ingredients apply; Codex CXS 1-1985 | Document whole-fruit content, added sweeteners, fiber calculation, processing method, shelf life, and claim substantiation. |
| 8 | Ready-to-Drink Oat or Grain Beverage | Plant-based energy, grain nutrients, and optional fortification | 200–250 mL | 2–8 g | Formula dependent | Codex CXS 1-1985; Codex CXS 192-1995 | Check cereal or gluten declarations, allergen management, fortification limits, added-sugar declaration, and stability data. |
| 9 | Unsweetened Tea or Botanical Infusion | Low-energy hydration with tea or botanical ingredients | 250–500 mL | 0–1 g | Meets benchmark if unsweetened | Codex CXS 1-1985; Codex CXS 192-1995 | Verify botanical identity, caffeine declaration where required, contaminant controls, additive permissions, and health-claim restrictions. |
| 10 | Micronutrient-Fortified Beverage for General Consumers | Vitamin and mineral delivery in a convenient liquid format | 200–330 mL | 0–8 g | Formula dependent | Codex CXS 1-1985; Codex CXS 192-1995 | Check nutrient forms, maximum permitted levels, tolerances, stability, daily-use instructions, and country-specific health claims. |
Interpretation: Sugar ranges are indicative formulation benchmarks per 100 mL and must be verified against the finished product specification. Sugars naturally present in milk are generally not classified as free sugars, whereas sugars in fruit juice and juice concentrates are included in the WHO free-sugar definition. Local laws may impose additional front-of-pack labeling, warning labels, nutrient limits, fortification rules, or claim requirements.
Core references: WHO Guideline: Sugars Intake for Adults and Children; FAO/WHO Codex Alimentarius Standards Database.
Global Buyer Evaluation: Nutrition, Claims, Shelf Life, Cost, and Certifications
Global buyers assess nutritional beverages through evidence, not attractive front labels. The McKinsey Future of Wellness 2024 report valued the global wellness market at about US$1.8 trillion. This signals opportunity, but also sharper scrutiny. Buyers compare protein, fibre, vitamins, sugar, calories, and serving size. Every claim should match laboratory results and local rules. “High protein” means little without a clear protein quantity per serving.
Nutrition claims need restraint. WHO recommends keeping free sugars below 10% of daily energy, with further benefits below 5%. Buyers should request an accredited nutrition panel, ingredient specifications, allergen controls, and contaminant testing. Codex guidance can support international consistency, while HACCP and ISO 22000 records strengthen supplier reliability. Claims still fail when translation changes their meaning. That happens.
Shelf life is a commercial calculation. A 12-month date is useful only when supported by real-time or accelerated stability testing. Review pH, water activity, sedimentation, colour, flavour, seal integrity, and microbial results. Packaging also matters during hot containers and long port delays. The 2024 PMMI beverage packaging outlook highlights continuing investment in flexible, efficient packaging systems. Lower freight weight can reduce cost, but lightweight packs may increase damage risk. Buyers should compare delivered cost, not factory price alone. Certifications, batch traceability, recall procedures, and corrective-action records reveal operational maturity. Some suppliers provide polished certificates but weak batch evidence. Careful buyers test the paperwork against the product.
Top 10 Nutritional Beverage Products for Global Buyers
Global Buyer Evaluation: Nutrition, Claims, Shelf Life, Cost, and Certifications
The chart uses a category-level buyer screening index from 0 to 100. Higher scores indicate stronger overall suitability for international sourcing. Nutrition reflects nutrient density, Claims reflects supportable front-of-pack positioning, Shelf Life reflects typical ambient stability, Cost reflects relative cost competitiveness, and Certifications reflects common export and food-safety certification readiness. Scores are indicative benchmarks for product categories rather than company or brand performance.
Related Posts
-
2026 How to Choose Natural Food Products for a Healthier Lifestyle?
-
Why Choose Organic Food Products for Global Buyers?
-
How to Embrace a Plant Based Lifestyle with Simple Tips?
-
Top 10 Dairy Free Alternatives in China You Should Try?
-
How will the future of plant based food shape global markets?
-
10 Best Whole Food Nutrition Sources for a Healthier Lifestyle?